Testing Strategy and Quality Gates
What this chapter covers
- Design and implement quality and release gates, including security and governance
- Design a comprehensive testing strategy, including local tests, unit tests, integration tests, and load tests
- Implement tests in a pipeline, including configuring test tasks, configuring test agents, and integration of test results
- Implement code coverage analysis
Continuous delivery is only as safe as the automated checks that guard it. This chapter covers what to test and where in the lifecycle (strategy), how to run tests and surface results in Azure Pipelines and GitHub Actions (implementation), and how to stop bad changes from progressing (quality gates, release gates and environment checks).
Designing a testing strategy
The test pyramid
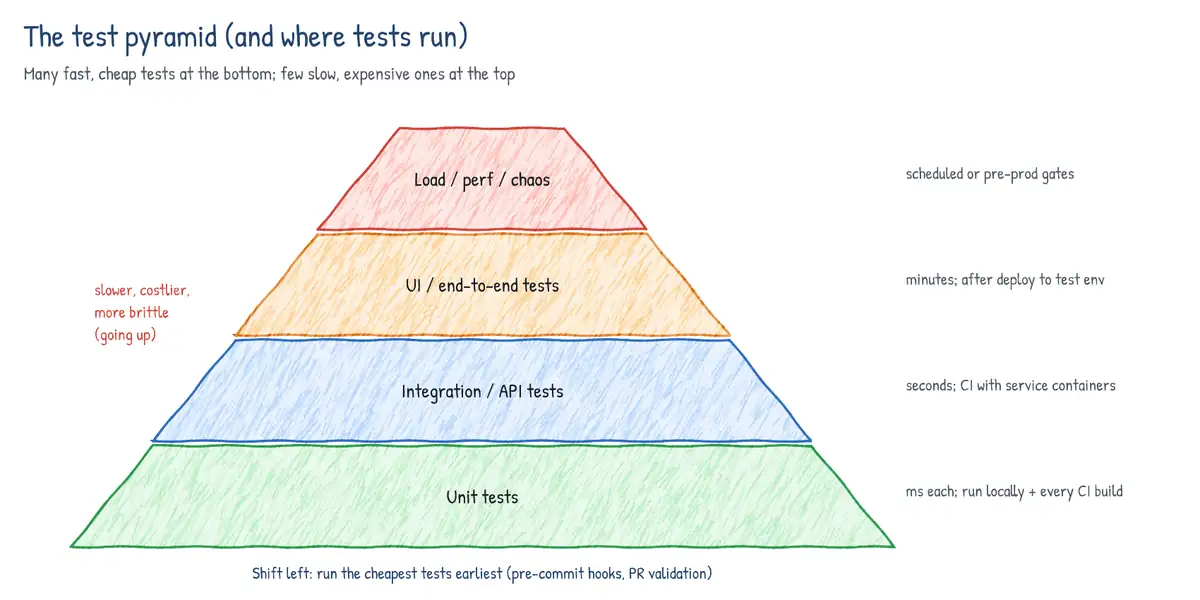
The test pyramid expresses a portfolio: many fast, cheap, isolated tests at the bottom and progressively fewer slow, expensive, brittle tests at the top. Inverting it (an 'ice-cream cone' of mostly manual or UI tests) gives slow feedback, flaky pipelines and late defect discovery. Microsoft's own shift-left journey replaced long-running functional tests with fast unit tests classified L0-L3 for exactly this reason.
| Level | Scope / dependencies | Speed | Where it runs |
|---|---|---|---|
| Local / pre-commit | Lint, format, fast unit subset, secret hooks | Seconds | Dev machine |
| Unit (L0) | One class/function, in-memory, mocks/fakes | ms each | Every CI and PR build |
| Unit with deps (L1) | Assemblies, SQL, file system | < 2 s each | CI / PR |
| Integration / functional (L2) | Real services, testable deployment | Minutes | After deploy to test env |
| End-to-end / UI (L3) | Full system, browser (Playwright, Selenium) | Slow | Staging, nightly |
| Load / performance | Azure Load Testing (JMeter, Locust) | Minutes-hours | Perf env |
| Security | SAST, SCA, secret scan, DAST | Varies | PR (SAST/SCA), staging (DAST) |
| Production / synthetic | Availability tests, smoke, chaos | Continuous | Production |
Test types in more detail
- Local tests - developers run unit tests and linters before pushing; Git hooks (pre-commit framework, Husky) and IDE test explorers make this cheap. Local tests give the fastest feedback but cannot be enforced; the PR build is the enforced copy.
- Unit tests - verify logic in isolation with test doubles; xUnit, NUnit, MSTest, Jest, Vitest, pytest, JUnit. They must be deterministic and independent of order and environment.
- Integration tests - verify that components work together: API + database, message handler + Service Bus. Use Testcontainers or pipeline service containers for dependencies, or run after deploying to an ephemeral/test environment.
- Load and performance tests - Azure Load Testing runs JMeter or Locust scripts at scale, integrates with Azure Pipelines (
AzureLoadTest@1) and GitHub Actions (azure/load-testing@v1), and supports fail criteria such asavg(response_time_ms) > 300orpercentage(error) > 5that fail the pipeline. The old cloud-based load testing feature of Azure DevOps is retired. - UI / end-to-end - Playwright (with cloud-hosted browsers through Microsoft's Playwright service) or Selenium. Windows UI tests that need an interactive desktop require a self-hosted agent configured to run interactively with auto-logon rather than as a service.
- Smoke tests - a handful of fast checks immediately after each deployment.
- Manual and exploratory testing - Azure Test Plans (plans, suites, test cases, Test & Feedback extension) for scenarios that need human judgement or are not worth automating.
Shift left (and shift right)
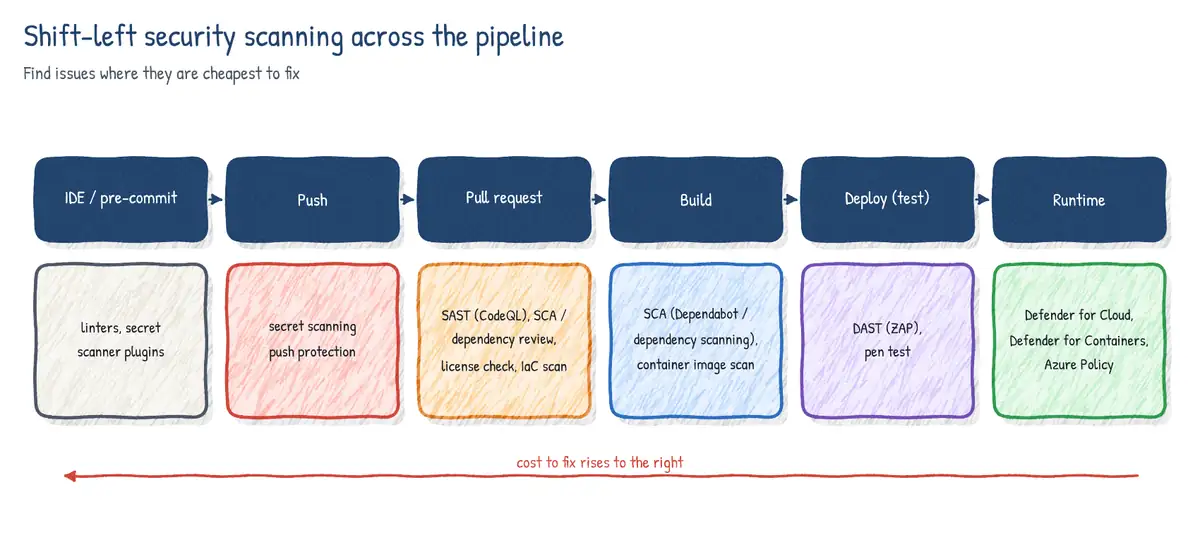
Shift left means moving testing, security and quality checks earlier: write unit tests with the code, run them on every PR, scan dependencies and code in the PR, and fail fast. Shift right complements it with testing in production: canary analysis, feature flags, synthetic monitoring and chaos engineering. Expect questions that ask you to place each check where it is cheapest yet still meaningful.
Running tests in Azure Pipelines
Test tasks
| Task | Purpose / notes |
|---|---|
| DotNetCoreCLI@2 (command: test) | Runs dotnet test; publishes TRX results by default |
| VSTest@3 | vstest.console on Windows; filters, distribution across agents, rerun failures |
| VisualStudioTestPlatformInstaller@1 | Gets the test platform from NuGet (no Visual Studio) |
| PublishTestResults@2 | JUnit, NUnit, VSTest (TRX), xUnit, CTest from any runner |
| PublishCodeCoverageResults@2 | Cobertura, JaCoCo, .coverage, .covx -> Code Coverage tab |
| Maven@4 / Gradle@3 | Run JUnit tests; can publish JUnit results and JaCoCo coverage |
| AzureLoadTest@1 | Run an Azure Load Testing test with fail criteria |
# .NET: run tests with coverage and publish both results and coverage
steps:
- task: UseDotNet@2
  inputs:
    version: 8.x
- task: DotNetCoreCLI@2
  displayName: Unit tests
  inputs:
    command: test
    projects: 'tests/**/*.UnitTests.csproj'
    arguments: >-
      -c Release --collect "XPlat Code Coverage"
      --results-directory $(Agent.TempDirectory)/tr
    publishTestResults: true          # default; results appear in the Tests tab
- task: PublishCodeCoverageResults@2
  displayName: Publish coverage
  condition: succeededOrFailed()
  inputs:
summaryFileLocation: '$(Agent.TempDirectory)/tr/**/coverage.cobertura.xml'# Python: any runner + PublishTestResults (publish even if tests fail)
steps:
- script: |
pip install -r requirements.txt pytest pytest-cov
pytest --junitxml=test-results.xml --cov=app --cov-report=xml
displayName: pytest
- task: PublishTestResults@2
condition: succeededOrFailed()
inputs:
testResultsFormat: JUnit
testResultsFiles: '**/test-results.xml'
testRunTitle: 'Python $(python.version)'
failTaskOnFailedTests: true
- task: PublishCodeCoverageResults@2
condition: succeededOrFailed()
inputs:
summaryFileLocation: '$(System.DefaultWorkingDirectory)/coverage.xml'# VSTest on Windows: filtered tests, sliced across 4 agents, rerun failures
jobs:
- job: tests
pool:
vmImage: windows-latest
strategy:
parallel: 4
steps:
- task: VSTest@3
inputs:
testSelector: testAssemblies
testAssemblyVer2: |
**\*Tests.dll
!**\obj\**
testFiltercriteria: 'TestCategory!=Slow'
distributionBatchType: basedOnExecutionTime
codeCoverageEnabled: true
rerunFailedTests: true
rerunMaxAttempts: 2
runInParallel: trueWith strategy: parallel: N (a multi-agent job) VSTest automatically slices tests across the N agents using System.JobPositionInPhase and System.TotalJobsInPhase; other runners can read those variables to slice themselves. Each slice consumes a parallel job. Test Impact Analysis (VSTest, managed code) runs only the tests affected by a change, shortening PR builds.
Test agents
The old Visual Studio Test Agent deployment tasks are deprecated; today a 'test agent' is simply an Azure Pipelines agent (Microsoft-hosted, self-hosted, or Managed DevOps Pools) with the test platform and tools installed. Considerations:
- Microsoft-hosted images include Visual Studio, browsers and common SDKs - good for unit and headless UI tests.
- Use self-hosted or Managed DevOps Pools agents for tests that need network line-of-sight to private test environments, licensed tools, GPUs or pre-seeded data.
- Windows UI tests that need a desktop session: self-hosted agent configured as an interactive process with auto-logon, with screen resolution set.
- Use
VisualStudioTestPlatformInstaller@1to acquire vstest without full Visual Studio. - Run tests in container jobs for reproducible tool versions and spin up dependencies as service containers.
Test results and Azure Test Plans integration
- Published results appear on the run's Tests tab (pass/fail, duration, attachments, stack traces), from where you can create a bug or link work items.
- Test analytics (pipeline > Analytics > Test failures) shows pass-rate trends, top failing tests and flakiness over time; the data is also available through Analytics views / OData.
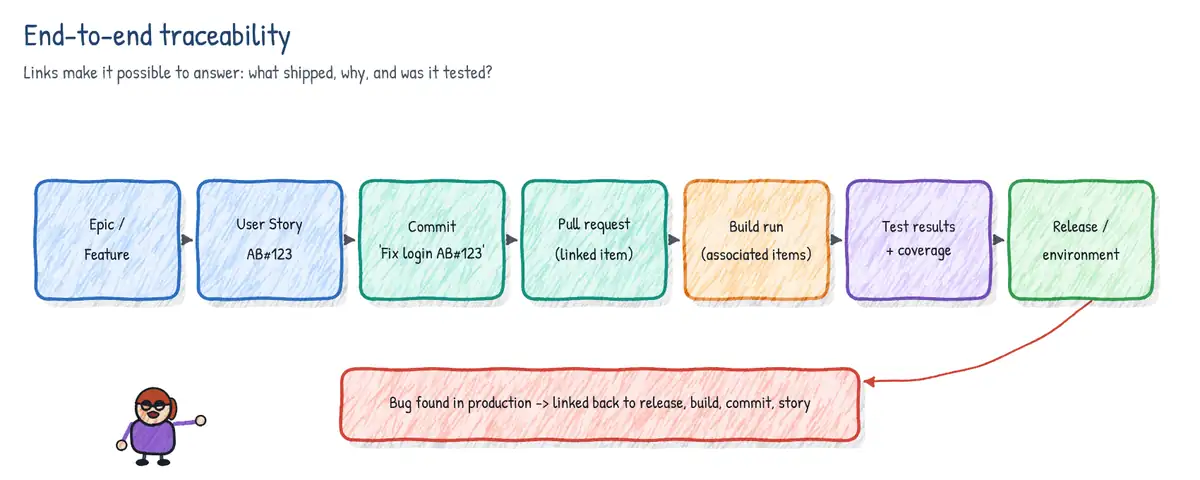
- Azure Test Plans (Basic + Test Plans access) organizes manual and automated test cases into plans and suites. Associate an automated test with a test case and run it from a plan through a pipeline; results roll up into progress reports and requirement traceability.
- The Requirements quality widget and the traceability chain link test results back to user stories.
Flaky test management
A flaky test passes and fails on the same code without any change. Azure DevOps has built-in flaky test management (Project settings > Test management):
- System detection: a test that fails and then passes on rerun within the same run (VSTest rerun) is marked flaky automatically.
- Custom detection: mark tests flaky manually or through the REST API from your own analysis.
- Option to exclude flaky test failures from the pass percentage so they do not fail the build while still being reported; a filter shows flaky tests on the Tests tab.
- Good practice: quarantine (tag the test with a category and filter it out), create a bug, fix the root cause (timing, shared state, order dependence, external dependency), then re-enable. Track flaky rate as a pipeline-health metric.
Code coverage
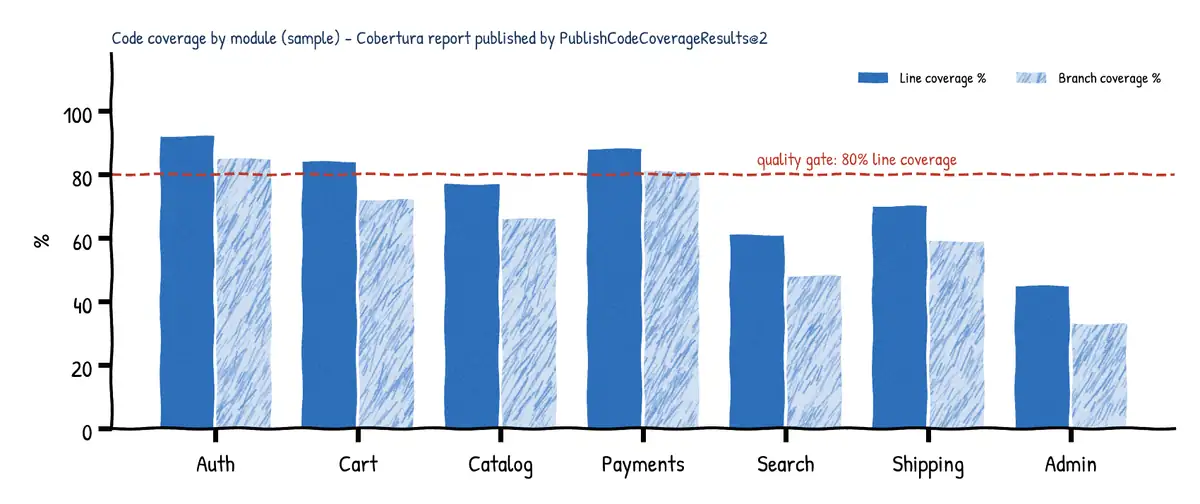
Code coverage measures which lines or branches executed during tests. It reveals untested code; high coverage does not prove the tests are good. Typical metrics: line, branch (decision) and function/method coverage. Formats you must recognize:
| Format | Ecosystem / producer |
|---|---|
| Cobertura (XML) | coverlet (.NET XPlat Code Coverage), pytest-cov, Istanbul/nyc, Jest |
| JaCoCo (XML) | Java (Maven / Gradle JaCoCo plugin) |
| .coverage / .covx | Microsoft Code Coverage (VSTest --collect "Code Coverage") |
| lcov | JavaScript tools; convert (e.g. ReportGenerator) before publishing |
- PublishCodeCoverageResults@2 accepts all of the above, merges multiple files and shows a Code Coverage tab with an HTML report. v1 is deprecated (it supported only Cobertura or JaCoCo and needed ReportGenerator for HTML).
- Diff (PR) coverage: for Azure Repos PRs, Azure DevOps can post coverage of changed lines as a comment and a status. Configure the target in
azurepipelines-coverage.ymlat the repo root and make that status a required check in branch policy. - Thresholds on overall coverage: the Build Quality Checks marketplace extension (
BuildQualityChecks@10) fails the build if coverage falls below a fixed value or below the previous build, or if warnings increase. SonarQube/SonarCloud quality gates are the other common choice. - In GitHub Actions, publish coverage through third-party actions or SonarCloud, and enforce it with required status checks in branch protection or rulesets.
# azurepipelines-coverage.yml (repo root) - PR diff coverage for Azure Repos
coverage:
  status:
    comments: on          # post per-file diff coverage as a PR comment
    diff:
target: 80% # changed lines must be >= 80% covered# Fail the build if line coverage < 75% or warnings grow (Build Quality Checks)
- task: BuildQualityChecks@10
inputs:
checkCoverage: true
coverageFailOption: fixed
coverageType: lines
coverageThreshold: '75'
checkWarnings: true
warningFailOption: build # compare with the previous build
baseBranchRef: refs/heads/mainQuality gates and release gates
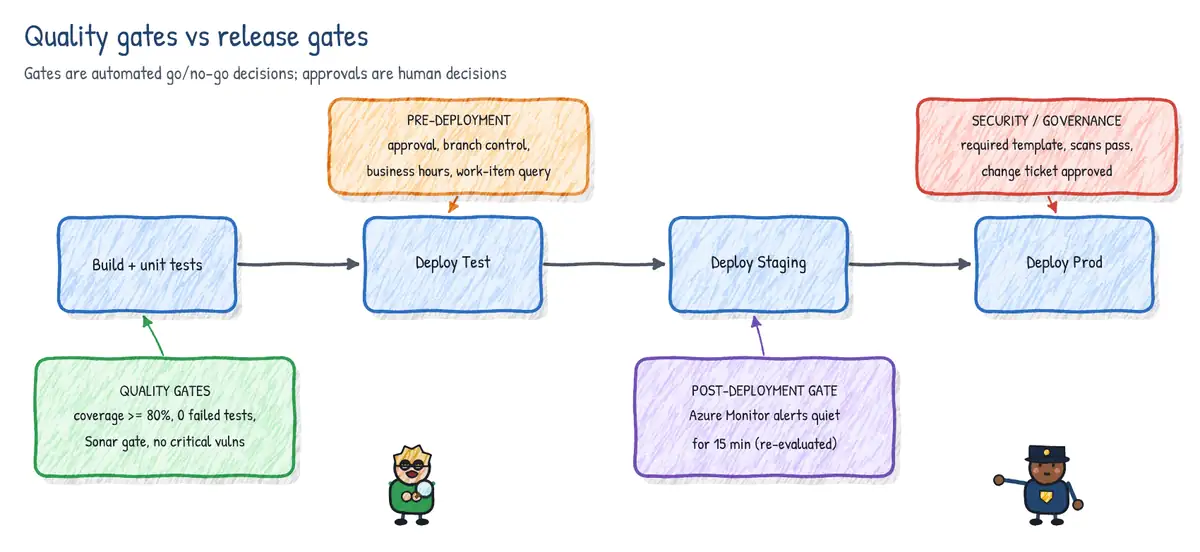
A quality gate is an automated, objective pass/fail decision on whether a change may progress. Gates exist at several points:
| Where | Mechanism | Examples |
|---|---|---|
| Pull request | Branch policies / protection & rulesets | Build validation, reviewers, status checks |
| Build / CI | Tasks that fail the job | Tests, coverage threshold, SAST, SCA, licenses |
| Before a YAML stage | Checks on environments/resources | Approval, Monitor alerts, REST, business hours |
| Classic release stage | Pre-/post-deployment gates | Work items, Monitor, REST/Function |
| GitHub deployment | Environment protection rules | Reviewers, wait timer, branches, apps |
Release gates in classic release pipelines
Classic release pipelines (now legacy, but still examined) let each stage have pre-deployment conditions (trigger, approvals, gates) and post-deployment conditions (gates, approvals). Gates are evaluated repeatedly: after an optional delay before evaluation, all gates are re-sampled at the time between re-evaluation interval until they all succeed in the same sampling interval or the timeout elapses, which fails the deployment. You can choose whether approvals happen before or after gates. Built-in gates:
- Query Azure Monitor alerts - passes if no matching alerts are active for the resource; a classic post-deployment health gate in canary/ring rollouts.
- Query work items - passes if a saved work-item query returns a count within bounds (e.g. zero open priority-1 bugs) - a governance gate.
- Invoke REST API - call any HTTP endpoint (change management such as ServiceNow, an incident system) and evaluate success criteria on the response.
- Invoke Azure Function - run custom logic; supports synchronous and asynchronous (callback) completion.
- Check Azure Policy compliance - evaluate policy compliance for the target resources.
- Marketplace gates: SonarQube quality gate, ServiceNow change management and others.
Checks on environments in YAML pipelines
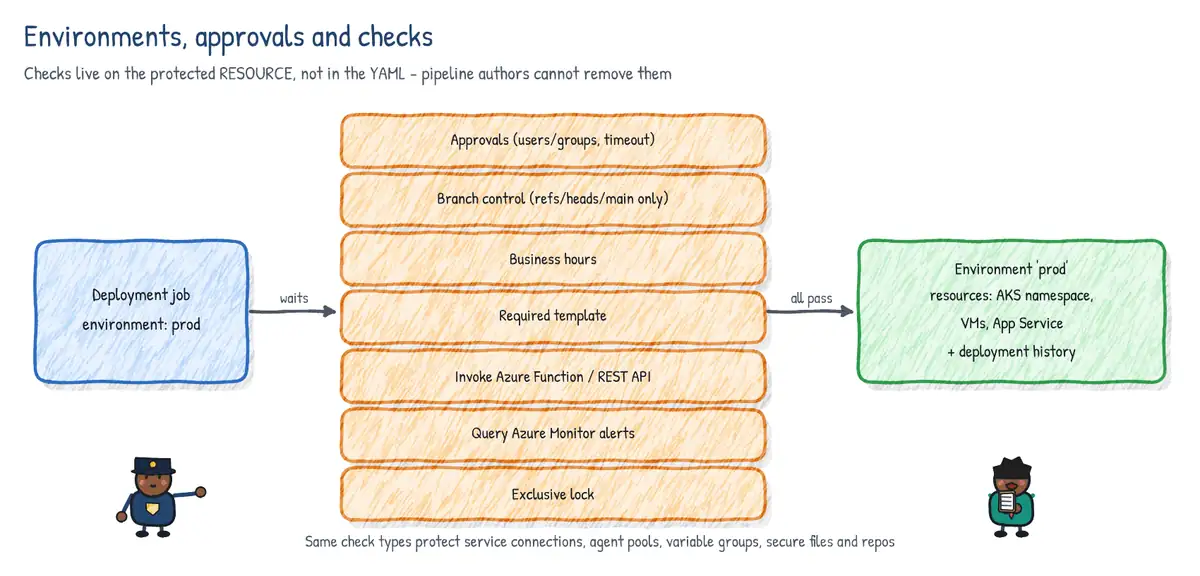
In YAML the equivalent of gates are checks on protected resources: environments, service connections, agent pools, variable groups, secure files and repositories. Checks run before a stage starts that uses the resource. There is no native post-deployment gate in YAML; model one with a following stage (for example a stage targeting a 'prod-verify' environment with a Query Azure Monitor alerts check) or with health steps inside the deployment strategy hooks. The full list of checks is covered in the pipelines chapter.
SonarQube / SonarCloud quality gates
SonarQube (self-hosted, also available as SonarQube Cloud) analyses code quality, coverage, duplication, bugs, code smells and security hotspots and computes a quality gate (for example 'coverage on new code >= 80%, no new blocker issues'). In Azure Pipelines use the extension tasks SonarQubePrepare -> build/test -> SonarQubeAnalyze -> SonarQubePublish; the gate result is shown on the run and decorates pull requests. To make the gate block, use the PR decoration status as a required status check in branch policy, or add a quality-gate gate/check before deployment.
- task: SonarQubePrepare@7
  inputs:
    SonarQube: sonarqube-conn          # service connection
    scannerMode: dotnet
    projectKey: contoso_orders
- script: dotnet build -c Release
- script: dotnet test -c Release --collect "XPlat Code Coverage"
- task: SonarQubeAnalyze@7
- task: SonarQubePublish@7
  inputs:
    pollingTimeoutSec: '300'
Security and governance gates
- Secret scanning push protection (GitHub, and GitHub Secret Protection for Azure DevOps) blocks the push itself - the earliest possible gate.
- Dependency review (
actions/dependency-review-action) fails a PR that introduces vulnerable or disallowed-license dependencies. In Azure DevOps, GitHub Code Security for Azure DevOps provides dependency scanning and CodeQL code scanning tasks whose alerts surface on PRs. - Code scanning (CodeQL) results as required checks, with severity thresholds in rulesets.
- Microsoft Defender for Cloud DevOps security connects GitHub, Azure DevOps and GitLab, aggregates findings, adds PR annotations and IaC scanning, and its container image assessment can feed deployment decisions.
- Azure Policy: compliance gate in classic releases and deny/audit effects at deployment.
- Required template check and
extendstemplates enforce that every production deployment runs mandated security steps. - Manual approvals by a change board or security team for high-risk stages, and branch control so only
mainorrelease/*can deploy to production. - License compliance: dependency review allow/deny lists or tools such as Mend or Black Duck.
Testing in GitHub Actions
name: ci
on:
  pull_request:
    branches: [main]
jobs:
  test:
    runs-on: ubuntu-latest
    strategy:
      fail-fast: false
      matrix:
        node: [20, 22]
    services:
      postgres:
        image: postgres:16
        env:
          POSTGRES_PASSWORD: test
        ports: ['5432:5432']
        options: >-
          --health-cmd pg_isready --health-interval 5s --health-retries 10
    steps:
      - uses: actions/checkout@v4
      - uses: actions/setup-node@v4
        with:
          node-version: ${{ matrix.node }}
          cache: npm
      - run: npm ci
      - run: npm test -- --ci --reporters=default --reporters=jest-junit
        env:
          DATABASE_URL: postgres://postgres:test@localhost:5432/postgres
      - uses: actions/upload-artifact@v4
        if: always()
        with:
          name: junit-node${{ matrix.node }}
          path: junit.xml
Make the test job a required status check in a branch protection rule or ruleset so a PR cannot merge until it passes. With a matrix, either require each generated check name or add a summary job that needs: all matrix legs and is the single required check.
Use case: 'Green build, broken checkout'
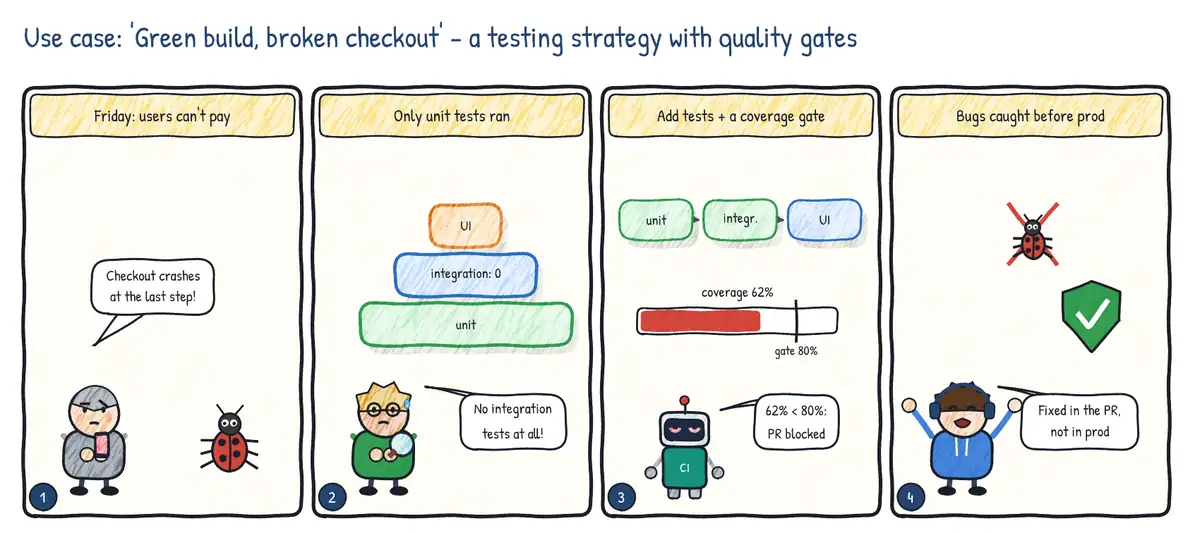
Situation. The CI build is always green, yet customers hit a crash at the last checkout step. The pipeline only runs unit tests, and nobody measures what the tests actually cover.
| Step | Practice | Feature used |
|---|---|---|
| 1 | Balance the test pyramid | Add integration tests with service containers; UI tests after deploy |
| 2 | Publish results to the pipeline | PublishTestResults@2, test tab, test analytics |
| 3 | Measure coverage | PublishCodeCoverageResults@2 (Cobertura / JaCoCo) |
| 4 | Make quality a gate | Coverage threshold (build quality checks) + build validation policy |