Instrumentation and Monitoring
What this chapter covers
- Configure monitoring for a DevOps environment: integrate Azure Monitor and Azure Monitor Logs with DevOps tools
- Configure collection of telemetry by using Application Insights, VM Insights, Container Insights, Azure Monitor for Storage, and Azure Monitor for Networks
- Configure monitoring in GitHub, including enabling insights and creating and configuring charts
- Create and configure alerts for events in GitHub Actions and Azure Pipelines
- Inspect infrastructure performance indicators, including CPU, memory, disk, and network
- Analyze metrics by using collected telemetry, including usage and application performance
- Inspect distributed tracing by using Application Insights
- Interrogate logs by using basic Kusto Query Language (KQL) queries
Domain 5 is the smallest slice of the exam (5-10%), but it is the part that closes the DevOps loop: you deploy, you observe, you learn, you feed what you learned back into the backlog. The exam expects you to know which Azure Monitor feature collects which signal, where that data lands, how to wire alerts into Azure Pipelines, GitHub Actions, Azure Boards, Teams and Slack, and how to read the data with basic Kusto Query Language (KQL). Expect at least one or two items that show a KQL query and ask what it returns, or ask you to pick the query that answers a question.
1. Azure Monitor architecture
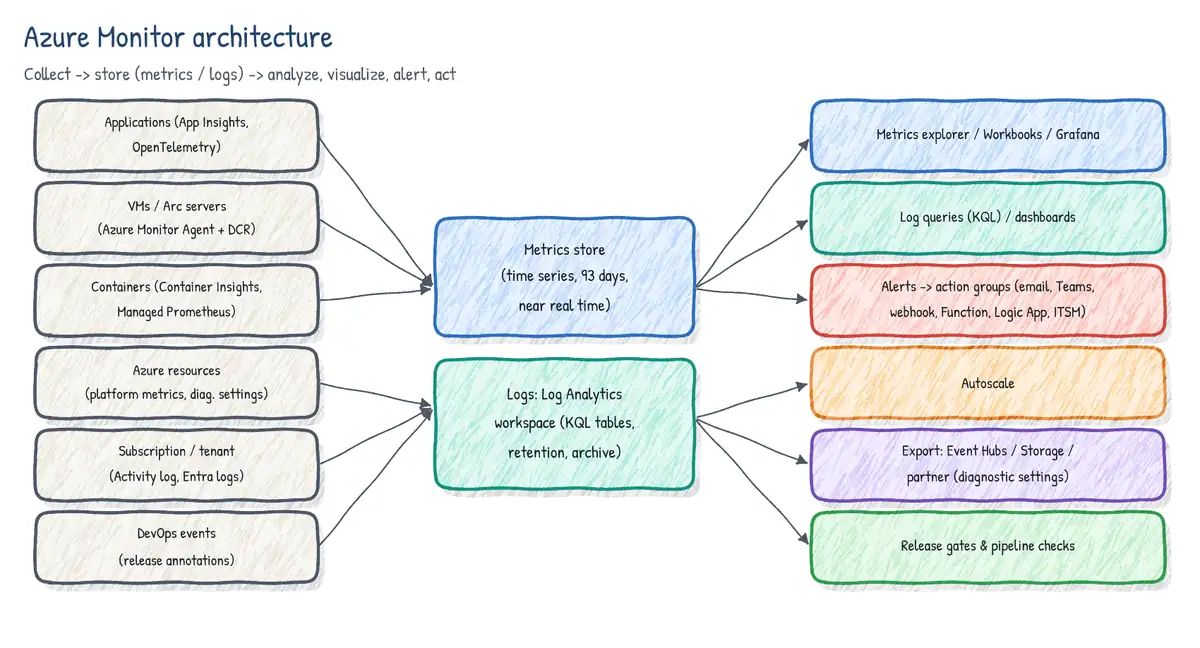
Azure Monitor is the umbrella platform for collecting, storing, analyzing and acting on telemetry from Azure, on-premises and other clouds. Everything you meet in this domain - Application Insights, VM Insights, Container Insights, Storage and Network insights, alerts, workbooks - is a feature of Azure Monitor that sits on top of a small number of data stores.
Data sources and data platform
| Tier / source | What it emits | How it is collected |
|---|---|---|
| Application code | Requests, dependencies, exceptions, traces, custom events | Application Insights (OpenTelemetry Distro / SDK / autoinstrumentation) |
| Guest OS (VM, VMSS, Arc server) | Perf counters, syslog, Windows events, IIS logs | Azure Monitor Agent (AMA) + data collection rule (DCR) |
| Azure resources | Platform metrics (automatic), resource logs (opt-in) | Metrics: automatic. Resource logs: diagnostic settings |
| Azure subscription | Activity log (control-plane writes, service health) | Automatic; export with a subscription diagnostic setting |
| Microsoft Entra tenant | Sign-in and audit logs | Entra diagnostic settings |
| Containers / Kubernetes | Prometheus metrics, stdout/stderr, inventory | Container Insights + Managed Prometheus (AMA-based) |
| Custom sources | Any JSON/CSV payload | Logs Ingestion API via a DCR (and optional DCE) |
Metrics versus logs
| Azure Monitor Metrics | Azure Monitor Logs | |
|---|---|---|
| Shape | Numeric time series with dimensions | Records with many typed columns |
| Store | Metrics database (platform); Azure Monitor workspace (Prometheus) | Log Analytics workspace tables |
| Latency | Near real time (about 1 minute or less) | Typically a few minutes |
| Default retention | Platform metrics 93 days | Analytics tables 30 days by default; up to 2 years interactive, 12 years total |
| Query tool | Metrics explorer, PromQL for Prometheus | Log Analytics with KQL |
| Best for | Fast, cheap alerting on a known number | Root cause, correlation, ad hoc analysis |
| Cost | Platform metrics are free to collect | Pay per GB ingested (plus long retention) |
Log Analytics workspace
A Log Analytics workspace is the container for log data: a set of tables, a region, a retention configuration, access control and a pricing/commitment tier. Workspace-based Application Insights, VM Insights, Container Insights, Microsoft Sentinel and Defender for Cloud all write into workspace tables. Design points the exam cares about:
- Fewer workspaces is usually better - one central workspace per region/environment simplifies cross-resource queries and commitment-tier discounts. Split only for data sovereignty, billing separation or very strict access needs.
- Access control mode: resource-context (users see only logs of resources they have RBAC on) versus workspace-context (permission on the workspace). Resource-context lets app teams query their own logs without seeing everything.
- Table plans: Analytics (full KQL, alerts, default), Basic (cheaper ingestion, limited query, for verbose debug logs), Auxiliary (lowest cost, for rarely-queried audit/compliance data).
- Retention: interactive (analytics) retention per table plus long-term (archive) retention up to 12 years; search jobs and restore bring archived data back for querying.
- Daily cap protects cost but drops data once hit - never rely on it for security-critical logs.
Azure Monitor Agent and data collection rules
The Azure Monitor Agent (AMA) is the single, current agent for collecting guest-OS data from Windows and Linux machines in Azure, on-premises (through Azure Arc) and other clouds. It replaced the legacy Log Analytics agent (also called MMA or OMS agent), which was retired on 31 August 2024, and it supersedes the Telegraf-based and diagnostics-extension paths for most scenarios. The legacy Dependency agent is still used alongside AMA for the VM Insights Map feature, but Map and the Dependency agent are deprecated (no new portal onboarding since 30 September 2025) and retire on 30 June 2028.
AMA does not carry its own configuration. What to collect is defined in a data collection rule (DCR): a standalone Azure resource that lists data sources (perf counters, Windows event logs with XPath filters, syslog facilities, text/JSON log files, IIS logs), an optional KQL transformation (transformKql) that filters or reshapes rows before ingestion, and one or more destinations (Log Analytics workspace, Azure Monitor workspace for metrics). A DCR is linked to machines with a data collection rule association (DCRA), so one DCR can cover hundreds of VMs, and a VM can have several DCRs - for example one owned by the platform team and one by security.
| Legacy approach | Current approach |
|---|---|
| Log Analytics agent (MMA/OMS) configured per workspace | Azure Monitor Agent configured by DCRs |
| Workspace 'agent configuration' blade | DCR resources, deployable with Bicep/ARM/Policy |
| Collect everything, filter at query time | Filter/transform at ingestion (transformKql) |
| Multihoming = multiple workspaces in one agent config | Multiple DCRs / destinations per VM |
| Classic Application Insights resource | Workspace-based Application Insights |
| Instrumentation key | Connection string (with Entra ID auth optional) |
| URL ping availability test | Standard availability test |
// Bicep: a DCR that collects CPU/memory/disk counters and error syslog to a workspace
resource dcr 'Microsoft.Insights/dataCollectionRules@2023-03-11' = {
  name: 'dcr-linux-baseline'
  location: location
  kind: 'Linux'
  properties: {
    dataSources: {
      performanceCounters: [
        {
          name: 'perfBaseline'
          streams: [ 'Microsoft-Perf' ]
          samplingFrequencyInSeconds: 60
          counterSpecifiers: [
            'Processor(*)\\% Processor Time'
            'Memory(*)\\Available MBytes Memory'
            'Logical Disk(*)\\Disk Transfers/sec'
            'Logical Disk(*)\\Avg. Disk sec/Transfer'
            'Network(*)\\Total Bytes'
          ]
        }
      ]
      syslog: [
        {
          name: 'syslogErrors'
          streams: [ 'Microsoft-Syslog' ]
          facilityNames: [ 'daemon', 'kern', 'auth' ]
          logLevels: [ 'Error', 'Critical', 'Alert', 'Emergency' ]
        }
      ]
    }
    destinations: {
      logAnalytics: [ { name: 'law', workspaceResourceId: workspaceId } ]
    }
    dataFlows: [
      { streams: [ 'Microsoft-Perf', 'Microsoft-Syslog' ], destinations: [ 'law' ] }
    ]
  }
}

resource dcra 'Microsoft.Insights/dataCollectionRuleAssociations@2023-03-11' = {
  name: 'vm-web01-baseline'
  scope: vm            // existing Microsoft.Compute/virtualMachines resource
  properties: { dataCollectionRuleId: dcr.id }
}Diagnostic settings and Event Hubs streaming
Platform metrics are collected automatically, but resource logs (for example Key Vault AuditEvent, App Service HTTP logs, Storage read/write logs, AKS control plane logs) are not collected until you create a diagnostic setting on the resource. A diagnostic setting picks log categories (or category groups such as allLogs / audit) and optionally AllMetrics, and sends them to up to one of each destination:
| Destination | Use it when |
|---|---|
| Log Analytics workspace | You want KQL, workbooks, log alerts, Sentinel |
| Storage account | Cheap long-term archive / compliance, rarely queried |
| Event Hubs | Stream to an external SIEM or tool (Splunk, Elastic, Datadog, custom consumer) |
| Partner solution | Native Azure partner integrations (for example Datadog, Elastic) |
The subscription activity log is also exported by a diagnostic setting at subscription scope; in a workspace it lands in the AzureActivity table. Each resource can have up to five diagnostic settings. Like AMA, diagnostic settings are usually enforced with Azure Policy (built-in 'Enable logging by category group ...' policies).
# Send all Key Vault logs + metrics to a workspace and an event hub
az monitor diagnostic-settings create \
  --name kv-to-law-and-eh \
  --resource $(az keyvault show -n kv-prod-01 --query id -o tsv) \
  --workspace $LAW_ID \
  --event-hub-rule $EH_AUTH_RULE_ID --event-hub insights-logs \
  --logs '[{"categoryGroup":"allLogs","enabled":true}]' \
--metrics '[{"category":"AllMetrics","enabled":true}]'2. Integrating Azure Monitor with DevOps tools
Monitoring data is only useful to a DevOps team when it reaches the places where work happens: the pipeline that decides whether to promote, the backlog where fixes are planned, and the chat channel where the on-call engineer lives.
Health-based gates in pipelines
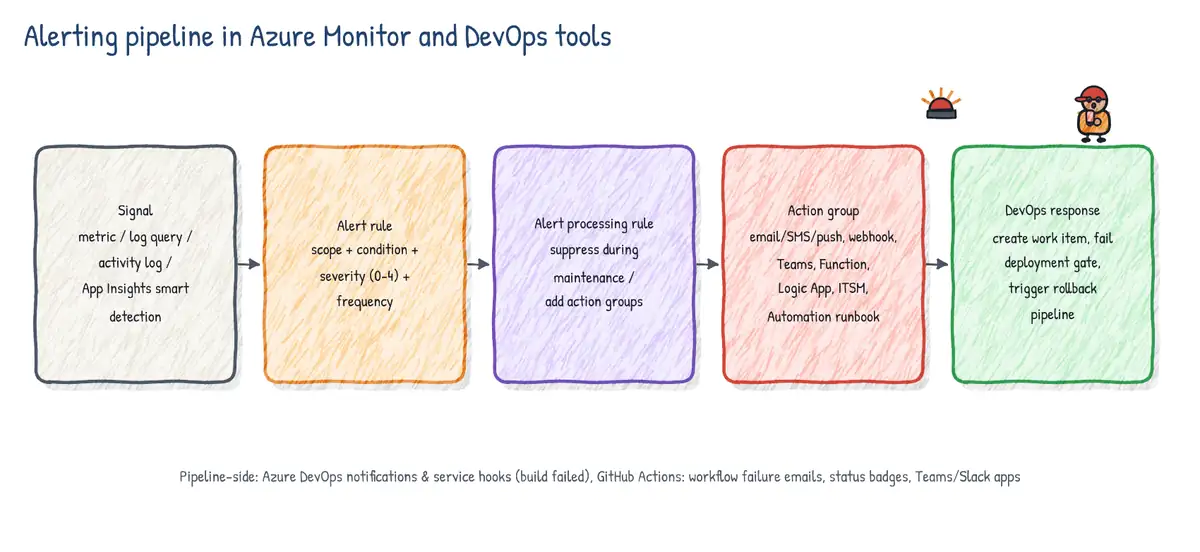
- YAML pipelines: add the Query Azure Monitor alerts check to an environment (or other protected resource). Before a stage that targets the environment runs, the check queries Azure Monitor for active alerts on the chosen scope/severity and keeps re-evaluating within its timeout; an active alert blocks the deployment. Combine with Invoke REST API or Invoke Azure Function checks for custom health signals.
- Classic release pipelines (legacy, still examined): the Query Azure Monitor alerts deployment gate, configurable as pre- or post-deployment gate with a sampling interval, a delay before evaluation and a timeout. A post-deployment gate lets a stage 'bake' and fail if alerts fire.
- Progressive delivery in YAML: the canary and rolling deployment strategies expose lifecycle hooks (
preDeploy,routeTraffic,postRouteTraffic,on: failure). Run health queries inpostRouteTrafficand roll back inon: failure. - GitHub Actions: use environment protection rules plus a custom deployment protection rule (a GitHub App) or a job step that queries Azure Monitor (
az monitor ...or a KQL query viaaz monitor log-analytics query) after the deployment and fails the job if errors spike.
Release annotations in Application Insights
A release annotation is a marker on Application Insights charts (Metrics explorer, workbooks, the Performance and Failures views) that shows when a deployment happened, so a jump in failures can be tied to a specific build. Annotations are created by an Azure Pipelines deployment (the App Service deploy task can create them automatically when the web app is linked to the Application Insights resource through its connection string app setting) or explicitly by calling the annotations API with Azure CLI from any pipeline - Azure Pipelines or GitHub Actions.
# GitHub Actions step: write a release annotation after deploying
- name: Create Application Insights release annotation
  uses: azure/cli@v2
  with:
    inlineScript: |
      AI_ID=$(az monitor app-insights component show -g rg-shop -a appi-shop \
              --query id -o tsv)
      ANN_ID=$(uuidgen)
      BODY=$(jq -n --arg id "$ANN_ID" --arg t "$(date -u +%Y-%m-%dT%H:%M:%SZ)" \
        --arg run "$GITHUB_SERVER_URL/$GITHUB_REPOSITORY/actions/runs/$GITHUB_RUN_ID" \
        '{Id:$id, AnnotationName:"Release ${{ github.sha }}", EventTime:$t,
          Category:"Deployment", Properties:({ReleaseUrl:$run}|tostring)}')
      az rest --method put \
        --uri "$AI_ID/Annotations?api-version=2015-05-01" --body "$BODY"
From telemetry to work items
- Application Insights work item integration: configure a work item template that points to an Azure DevOps project (Azure Boards) or a GitHub repository; then from a failed request, exception or end-to-end transaction you can create a bug/issue pre-filled with the telemetry details and a deep link back to the trace.
- Alert-driven work items: an alert's action group calls a Logic App (Azure DevOps connector 'Create a work item' or GitHub 'Create an issue') or a webhook/Azure Function that calls the Azure DevOps REST API. This is the standard way to 'automatically create a bug in Azure Boards when an alert fires'.
- ITSM action in an action group connects alerts to ServiceNow and similar tools.
- Azure Monitor workbooks and dashboards can be pinned/linked in Azure Boards dashboards or wikis; Azure DevOps dashboards themselves show pipeline and test widgets, not Azure Monitor data natively.
3. Application Insights
Application Insights is the application performance monitoring (APM) feature of Azure Monitor. It collects requests, dependency calls, exceptions, traces (logs), page views, custom events and metrics, availability results and performance counters, and gives you Application Map, Live Metrics, Performance, Failures, Transaction search, Usage analytics and smart detection.
Workspace-based resources
Classic (standalone) Application Insights resources were retired on 29 February 2024; every Application Insights resource is now workspace-based, which means its telemetry is stored in a Log Analytics workspace in tables such as AppRequests, AppDependencies, AppExceptions, AppTraces, AppPageViews, AppAvailabilityResults, AppEvents and AppMetrics. Querying from the Application Insights Logs blade still exposes the familiar classic names (requests, dependencies, exceptions, traces, pageViews, customEvents, availabilityResults) as a compatibility view, with classic column names.
| Classic name (AI Logs blade) | Workspace table | Key column differences |
|---|---|---|
| requests | AppRequests | timestamp/TimeGenerated, duration/DurationMs, name/Name |
| dependencies | AppDependencies | target/Target, type/DependencyType |
| exceptions | AppExceptions | type/ExceptionType, outerMessage/OuterMessage |
| traces | AppTraces | message/Message, severityLevel/SeverityLevel |
| customEvents | AppEvents | name/Name, customDimensions/Properties |
| availabilityResults | AppAvailabilityResults | location/Location, success/Success |
| operation_Id, cloud_RoleName | OperationId, AppRoleName | Correlation and role columns |
Connection string vs instrumentation key
Telemetry is sent to Application Insights using a connection string such as InstrumentationKey=...;IngestionEndpoint=https://westeurope-5.in.applicationinsights.azure.com/;LiveEndpoint=...;ApplicationId=.... Support for ingestion that relies only on the instrumentation key ended on 31 March 2025: the key alone cannot route data to regional endpoints, sovereign clouds or private links. Store the connection string in the APPLICATIONINSIGHTS_CONNECTION_STRING environment variable/app setting (not in source code). The connection string is not a secret in the strict sense (it only allows sending data), but to stop anyone from sending spoofed telemetry, enable Microsoft Entra ID authentication for ingestion and disable local authentication on the resource, then use a managed identity.
OpenTelemetry and the Azure Monitor OpenTelemetry Distro
Microsoft's recommended instrumentation path is OpenTelemetry (OTel). The Azure Monitor OpenTelemetry Distro packages the OTel SDK, common instrumentation libraries (HTTP server and client, SQL, Azure SDK, logging) and the Azure Monitor exporter into one package per language - Azure.Monitor.OpenTelemetry.AspNetCore for .NET, @azure/monitor-opentelemetry for Node.js, azure-monitor-opentelemetry for Python, and the Application Insights Java 3.x agent for Java. OTel spans map to requests (server/consumer spans) and dependencies (client/producer/internal spans); OTel logs map to traces and exceptions; OTel metrics map to custom metrics. The classic Application Insights SDKs are in maintenance; new work should use the distro.
// .NET 8 ASP.NET Core - Program.cs
using Azure.Monitor.OpenTelemetry.AspNetCore;

var builder = WebApplication.CreateBuilder(args);
// Reads APPLICATIONINSIGHTS_CONNECTION_STRING from configuration/environment
builder.Services.AddOpenTelemetry()
    .UseAzureMonitor(o => o.SamplingRatio = 0.25F)   // keep 25% of traces
    .ConfigureResource(r => r.AddService("checkout-api"));  // -> cloud_RoleName
var app = builder.Build();
app.MapGet("/", () => "ok");
app.Run();# Python (Flask/FastAPI/Django) - first lines of the app
from azure.monitor.opentelemetry import configure_azure_monitor
configure_azure_monitor() # uses APPLICATIONINSIGHTS_CONNECTION_STRING
# OTEL_SERVICE_NAME=checkout-api sets the role name shown in Application MapAutoinstrumentation (codeless) is also available for App Service, Azure Functions, AKS (Java/Node.js autoinstrumentation) and VMs/on-premises IIS (.NET), letting you enable Application Insights without changing code - good for brownfield apps; the distro gives more control (custom spans, custom metrics, sampling).
Availability tests
| Test type | Status in 2026 | Notes |
|---|---|---|
| Standard test | Current, recommended | Any HTTP verb, headers, body; SSL cert checks; multi-region |
| Custom TrackAvailability() test | Current | Your code (for example a timer Function) runs multi-step checks |
| URL ping test (classic) | Deprecated; retires 30 Sep 2028 (extended from 2026) | Migrate to standard tests |
| Multistep web test (Visual Studio .webtest) | Retired (Aug 2024) | Replace with custom TrackAvailability tests |
Recommended setup: run from at least five locations and alert when, for example, 3 of 5 locations fail (the default availability alert uses a location-failure threshold, which avoids paging on a single flaky probe). Results land in availabilityResults / AppAvailabilityResults.
Investigation experiences
| Feature | What it gives you | Typical exam trigger |
|---|---|---|
| Live Metrics | 1-second latency stream of requests, failures, CPU, sample traces; not stored | 'watch a deployment as it happens', 'validate a fix in real time' |
| Application Map | Topology of components (cloud_RoleName) with call volume, latency, failures | 'identify which downstream dependency causes errors' |
| Performance blade | Operations by duration percentiles; drill into samples and profiler traces | 'find the slowest operations', 'P95 latency' |
| Failures blade | Failed requests, dependency failures, exceptions grouped by type/code | 'top exception types since the release' |
| Transaction search / end-to-end view | One operation across all components as a Gantt chart | 'trace a single user request across microservices' |
| Smart detection | ML anomaly alerts: failure rate, response time, dependency, memory leak | 'detect anomalies without thresholds' |
| Profiler / Snapshot Debugger | Code-level hot paths; variable state at exception time | 'find which method is slow' / 'debug exception in production' |
Smart detection rules can be migrated to (and for new resources are created as) standard Azure Monitor alert rules that use action groups - so the same routing (email, Teams via Logic App, webhook to Azure Boards) applies.
Sampling
Sampling reduces telemetry volume and cost while keeping statistically correct metrics. Because sampling decisions are made per operation (trace ID), all items for one transaction are kept or dropped together, so distributed traces stay complete. Each kept record carries itemCount (how many original items it represents) - use sum(itemCount) rather than count() when counting sampled telemetry.
| Sampling type | Where | Notes |
|---|---|---|
| Adaptive sampling | Classic ASP.NET/ASP.NET Core SDK (default on) | Adjusts rate automatically to stay under a target items/sec |
| Fixed-rate sampling | SDK or OpenTelemetry distro (SamplingRatio) | Same percentage everywhere; keep consistent across services for complete traces |
| Rate-limited sampling | Newer OpenTelemetry distro versions, Java agent | Caps traces per second |
| Ingestion sampling | At the Application Insights endpoint | Last resort; saves storage cost, not network bandwidth |
Usage analytics
For web front ends instrumented with the JavaScript SDK (or the JavaScript snippet), Application Insights offers product-analytics views built from page views and custom events:
- Users / Sessions / Events - how many distinct users and sessions used a page or feature, split by country, browser, custom property. Users are identified by an anonymous cookie (or an authenticated user ID you set).
- Funnels - a fixed sequence of steps (for example view product -> add to cart -> checkout -> pay) and the conversion/drop-off at each step.
- User Flows - a Sankey-style view of what users do before and after a given page or event; useful to discover unexpected navigation paths.
- Retention - how many users come back over days/weeks after doing an initial action (cohort grid).
- Cohorts - saved sets of users/sessions/events reusable across the other tools.
- Impact - correlates page load time (or other properties) with conversion of a later event.
4. Infrastructure insights
VM Insights
VM Insights monitors Azure VMs, scale sets and Arc-enabled servers. Enabling it deploys AMA plus a VM Insights DCR that collects a curated performance set into the InsightsMetrics table (Namespace/Name pairs such as Processor/UtilizationPercentage, Memory/AvailableMB, LogicalDisk/FreeSpacePercentage, LogicalDisk/TransfersPerSecond, LogicalDisk/ReadLatencyMs, Network/ReadBytesPerSecond). Optionally the (deprecated, retiring 30 June 2028) Dependency agent enables the Map feature: processes, inbound/outbound connections and dependent machines (tables VMComputer, VMProcess, VMConnection, VMBoundPort). Microsoft has been extending VM Insights with an OpenTelemetry-based guest metrics experience stored in an Azure Monitor workspace; the Log Analytics-based experience above remains the one most exam content uses.
Note the difference between host metrics (Percentage CPU, Disk Read Operations/Sec, Network In Total - collected automatically by the Azure platform without any agent) and guest metrics (memory used, per-process CPU, logical disk free space - need AMA because the hypervisor cannot see inside the OS). Logical disk free space and per-process data are classic examples. (Azure has added an 'Available Memory Bytes' host metric, in preview, but detailed memory counters such as paging and committed bytes still need the agent.)
Container Insights, Managed Prometheus and Grafana
For AKS (and Arc-enabled Kubernetes) the current recommended stack is:
- Azure Monitor managed service for Prometheus - scrapes Prometheus metrics (node, kubelet, kube-state-metrics, cAdvisor, your app's /metrics) with the AMA metrics add-on and stores them in an Azure Monitor workspace (a different resource from a Log Analytics workspace), queried with PromQL. Prometheus recording rules and Prometheus alert rule groups run in Azure.
- Container Insights (logs) - AMA-based collection of container stdout/stderr into
ContainerLogV2(the default schema;ContainerLogis the legacy schema), plus Kubernetes inventory and events intoKubePodInventory,KubeNodeInventory,KubeEventsand performance intoPerf/InsightsMetrics. Cost presets and DCR settings control namespaces, streams and collection interval.ContainerLogV2can use the Basic table plan to reduce cost. - Azure Managed Grafana - fully managed Grafana with a built-in data source for the Azure Monitor workspace and Log Analytics, shipping prebuilt Kubernetes dashboards. Grafana dashboards are also available directly in the Azure portal (Azure Monitor dashboards with Grafana).
- Enable everything with
az aks create/update --enable-azure-monitor-metrics --azure-monitor-workspace-resource-id ... --grafana-resource-id ...and--enable-addons monitoring(or the portal Monitor settings).
# Enable Managed Prometheus + Grafana link + Container Insights on an existing AKS cluster
az aks update -g rg-aks -n aks-prod \
  --enable-azure-monitor-metrics \
  --azure-monitor-workspace-resource-id $AMW_ID \
  --grafana-resource-id $GRAFANA_ID
az aks enable-addons -g rg-aks -n aks-prod -a monitoring \
  --workspace-resource-id $LAW_ID
Azure Monitor for Storage (Storage insights)
Storage insights is a ready-made workbook experience over storage account platform metrics - no agent or setup required for the overview. It shows Capacity (used capacity, blob/file/queue/table counts), Availability, Transactions split by API name and response type (for example ClientThrottlingError, AuthorizationError), and latency: SuccessE2ELatency (end-to-end including network/client) versus SuccessServerLatency (time spent inside Azure Storage). A large gap between E2E and server latency points to the client or network, not to Storage. For per-request detail (who read which blob, with which auth), create a diagnostic setting on the blob/file/queue/table service to send resource logs to StorageBlobLogs, StorageFileLogs, StorageQueueLogs, StorageTableLogs.
Azure Monitor for Networks (Network insights) and Network Watcher
Network insights is a single pane for network resources: topology, health and metrics of VNets, gateways, load balancers, Application Gateway, Front Door, firewalls, ExpressRoute, with tabs for Connectivity (Connection Monitor tests) and Traffic (flow logs / traffic analytics). It builds on Azure Network Watcher, the regional service that provides diagnostic tools:
| Network Watcher tool | Answers the question |
|---|---|
| Connection Monitor | Continuous A-to-B reachability, latency, packet loss (replaces NPM) |
| IP flow verify | Would an NSG allow or deny this 5-tuple to/from a VM, and which rule? |
| NSG diagnostics | Which effective NSG rules apply to a flow (also for VMSS, App Gateway) |
| Next hop | Where will a packet from this VM be routed (UDR, appliance, gateway)? |
| Connection troubleshoot | One-off reachability test from a VM/App Gateway/Bastion to an endpoint |
| Packet capture | Capture traffic on a VM/VMSS for deep analysis |
| VPN troubleshoot | Diagnose a VPN gateway or connection |
| Flow logs + Traffic analytics | Who talks to whom, allowed/denied; VNet flow logs replace NSG flow logs |
| Topology | Visual map of resources in a VNet |
NSG flow logs: new ones cannot be created since 30 June 2025 and they retire on 30 September 2027 - use VNet flow logs with traffic analytics instead. Connection Monitor replaced classic Connection Monitor and Network Performance Monitor (NPM).
5. Monitoring in GitHub
GitHub has no Azure Monitor equivalent, but it offers repository, organization and project insights that the exam groups under 'monitoring in GitHub, including enabling insights and creating and configuring charts'.
Repository Insights tab
| Insights page | Shows |
|---|---|
| Pulse | Activity summary over a period: merged/open PRs, closed/new issues, commits, authors |
| Contributors | Commits/additions/deletions per contributor over time (default branch) |
| Community / Community standards | Health files: README, CODE_OF_CONDUCT, CONTRIBUTING, LICENSE, templates |
| Traffic | Views, unique visitors, clones, referrers, popular content (14 days) |
| Commits / Code frequency | Weekly commit activity; additions/deletions per week |
| Dependency graph | Manifests, dependencies, dependents; SBOM export; basis for Dependabot alerts |
| Network / Forks | Branch/fork history graph; list of forks |
The dependency graph is enabled by default for public repositories; for private repositories an admin enables it (Settings > Code security). It also supports SBOM export (SPDX) and dependency submission API for build-time dependencies.
Organization insights for GitHub Actions
At organization level (Insights tab of the organization, for organization owners and users granted the 'view organization Actions metrics' permission), GitHub provides Actions usage metrics (minutes consumed by workflow, job, repository, runner type, runtime OS) and Actions performance metrics (average run time, queue time, failure rate per workflow/job/repository). Use them to find the most expensive workflows, slow queues (need more runners or larger runners), and flaky/failing jobs. Billing detail for minutes and storage is in the billing settings and usage reports.
GitHub Projects insights (charts)
Projects (the current, table/board/roadmap-based Projects) have an Insights button that creates charts from project items. You create a chart, then configure it:
- Layout: bar, column, line, stacked area, stacked bar, stacked column.
- X-axis: a field such as Status, Assignees, Iteration, a single select, or Time (for historical charts).
- Group by (optional): another field to split/stack the series, for example Priority.
- Y-axis: Count of items or the sum/average/min/max of a number field such as Estimate.
- Filter: the same filter syntax as views, for example
is:issue label:bug -status:Done. - Current charts show a snapshot; historical charts (X-axis = Time) show trends such as a burn-up or cumulative flow. Historical charts depend on your plan for private projects.
Alerts and notifications for GitHub Actions
- Personal notifications: Settings > Notifications > Actions - receive web/email notifications for workflow runs you triggered, optionally only for failed workflows.
- Workflow status badge:
- can filter bybranchandevent. - GitHub app for Microsoft Teams / Slack:
@GitHub subscribe owner/repo workflows:{event:"push" branch:"main"}(Teams) or/github subscribe owner/repo workflows:{...}(Slack) posts run status and lets you approve deployments in chat. - In-workflow alerting: a final job with
if: failure()(orif: ${{ failure() }}at step level) that posts to a Teams/Slack webhook, opens an issue withgh issue create, or calls PagerDuty. - Webhooks:
workflow_runandworkflow_jobwebhook events notify external systems; inside GitHub,on: workflow_runwithtypes: [completed]triggers follow-up workflows.
# Notify a Teams/Slack channel when any job in this workflow fails
jobs:
  build:
    runs-on: ubuntu-latest
    steps: [ { uses: actions/checkout@v4 }, { run: make test } ]
  notify-failure:
    needs: [build]
    if: ${{ failure() }}
    runs-on: ubuntu-latest
    steps:
      - name: Post to chat
        run: |
          curl -sS -H 'Content-Type: application/json' -X POST "$HOOK" \
            -d "{\"text\":\"CI failed: $GITHUB_REPOSITORY run $GITHUB_RUN_ID\"}"
        env:
          HOOK: ${{ secrets.CHAT_WEBHOOK_URL }}
      - name: Open tracking issue
        run: gh issue create -R "$GITHUB_REPOSITORY" -t "CI failure $GITHUB_RUN_ID" -b "See"
        env:
          GH_TOKEN: ${{ github.token }}   # needs permissions: issues: write
6. Alerts in Azure Monitor and Azure Pipelines
Azure Monitor alert types
| Alert type | Signal | Example |
|---|---|---|
| Metric alert | Platform/custom metrics, Prometheus not included | CPU > 80% for 15 min; dynamic thresholds learn seasonality |
| Log search alert | KQL query on a workspace/App Insights, run on a schedule | More than 5 HTTP 500s in AppRequests in 5 min |
| Activity log alert | Activity log events: administrative, service health, resource health | Someone deleted a resource group; a region outage |
| Prometheus alert | PromQL rule group on an Azure Monitor workspace | Pod restarts > 3 |
| Smart detection alert | Application Insights anomaly detection | Failure rate anomaly |
| Availability test alert | Standard test failing in N locations | 3 of 5 locations down |
Metric alerts are stateful (they fire once and resolve automatically when the condition clears) and can monitor multiple resources of the same type in one region with a single rule. Log search alerts can be stateful or stateless, evaluate every 1 minute or more, and support dimensions (one alert per computer/role) - but they are more expensive and slower than metric alerts. Activity log alerts are free and fire on control-plane events.
Action groups and alert processing rules
An action group is a reusable list of notifications (email, SMS, Azure app push, voice, email Azure Resource Manager role) and actions (Automation runbook, Azure Function, Event Hubs, ITSM, Logic App, webhook, secure webhook with Entra auth). Many alert rules reference the same action group. An alert processing rule sits between alerts and action groups at a scope (subscription, resource group, resource) to suppress notifications (for example during a planned maintenance window on a schedule) or to add action groups to all alerts in scope (for example route every Sev0/Sev1 in production to the on-call group) - without editing each alert rule.
# Action group + metric alert + maintenance-window suppression rule
az monitor action-group create -g rg-mon -n ag-oncall --short-name oncall \
  --action email sre sre@contoso.com \
  --action webhook boards https://prod-01.westeurope.logic.azure.com/workflows/...

az monitor metrics alert create -g rg-mon -n cpu-high-web \
  --scopes $VMSS_ID --condition "avg Percentage CPU > 80" \
  --window-size 15m --evaluation-frequency 5m --severity 2 --action ag-oncall

az monitor alert-processing-rule create -g rg-mon -n suppress-sat-maint \
  --rule-type RemoveAllActionGroups --scopes $RG_PROD_ID \
  --schedule-recurrence-type Weekly --schedule-recurrence Saturday \
  --schedule-start-datetime '2026-10-10 22:00:00' \
  --schedule-end-datetime '2027-10-10 02:00:00' \
  --schedule-time-zone 'Romance Standard Time'
Notifications in Azure Pipelines
- Notification subscriptions (Project settings > Notifications, team or personal): built-in templates such as 'A build fails', 'Run stage waiting for approval', 'A deployment completed'. Filters can target a specific pipeline, branch or requester. Delivery: email or SOAP/service hook.
- Service hooks (Project settings > Service hooks): push events such as Build completed, Run state changed, Run stage state changed, Run job state changed, Release deployment completed to Microsoft Teams, Slack, Azure Service Bus, Azure Storage queues, Jenkins, Trello, generic webhooks and more.
- Azure Pipelines app for Microsoft Teams / Slack:
@azure pipelines subscribe <pipeline URL>(Teams) or/azpipelines subscribe <pipeline URL>(Slack); approve YAML stage approvals directly from the chat card. - Status badges: Pipelines > ... > Status badge gives Markdown for a README; for a public view the project setting 'Disable anonymous access to badges' must be off.
- Pipeline analytics (Analytics tab, Pipeline pass rate, Test failures, Duration reports) and the Analytics OData feed give health trends; covered in depth in Domain 3.
7. Analyzing infrastructure and application performance
Infrastructure indicators
| Resource | Key indicators | Healthy signal / warning sign |
|---|---|---|
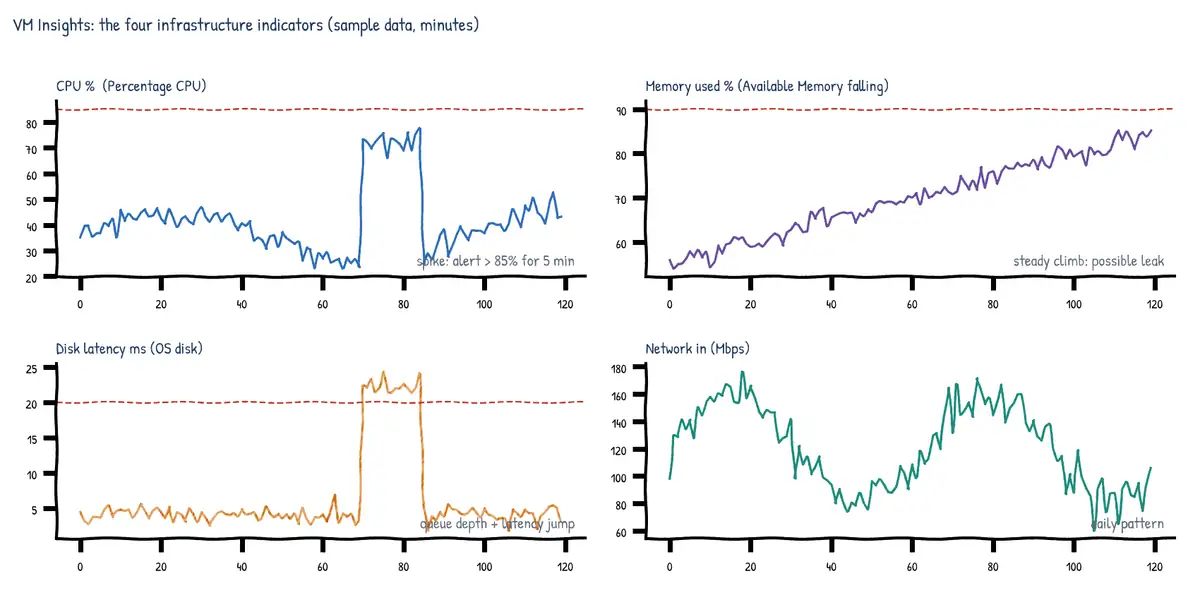
| CPU | % processor time, CPU credits (B-series), run queue / load | Sustained > 80-85% or credits exhausted = scale up/out |
| Memory | Available MB, % committed bytes, page faults/swap | Low available + high paging = memory pressure, leak |
| Disk | IOPS (transfers/sec), throughput MB/s, latency (sec/transfer), queue depth | Latency > 20-25 ms or IOPS at disk/VM cap = throttling |
| Network | Bytes in/out, packets, dropped packets, TCP connections, flows | Hitting VM bandwidth limit, SNAT port exhaustion on outbound |
| App platform | HTTP queue length, thread count, GC time, connection pool usage | Growing queue = backend saturation |
Remember that a managed disk and the VM size each have IOPS/throughput caps; the platform metrics Data Disk IOPS Consumed Percentage and VM Uncached IOPS Consumed Percentage tell you which cap is being hit. Disk queue depth rising together with latency is the classic signature of a disk that is too small for the workload.
Application performance
- Request rate, response time, failure rate (the RED method: Rate, Errors, Duration) are the first three charts on the Application Insights Overview.
- Use percentiles, not averages: P50 shows the typical user, P95/P99 show the tail. An average can hide that 5% of users wait 10 seconds. The Performance blade sorts operations by P50/P95/P99 duration and count.
- Dependencies (SQL, HTTP, Service Bus, Storage, Cosmos DB) usually dominate request time - compare request duration with summed dependency duration in the end-to-end view.
- Failures: group by
resultCode, exceptiontype, dependencytarget. A spike in 5xx with one failing dependency points to that dependency; 4xx increases often point to a client or routing change after a deployment. - Compare before and after a release using release annotations and the time-range compare feature in the Performance/Failures blades.
8. Distributed tracing
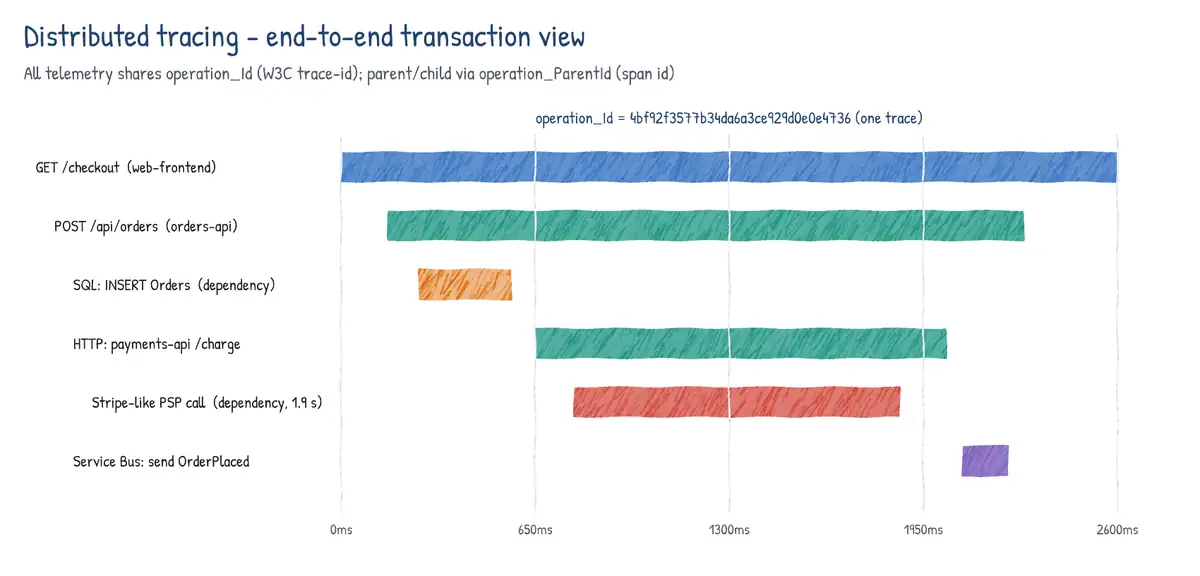
In a microservice system one user click can traverse a gateway, three APIs, a queue and a database. Distributed tracing stitches all of that into one operation by propagating a correlation context on every hop. Application Insights and OpenTelemetry use the W3C Trace Context standard: the HTTP header traceparent carries version-traceid-parentid-flags, for example 00-4bf92f3577b34da6a3ce929d0e0e4736-00f067aa0ba902b7-01, and the optional tracestate carries vendor data. (The older Request-Id / hierarchical correlation is legacy.)
| Application Insights field | W3C / OpenTelemetry concept | Meaning |
|---|---|---|
| operation_Id / OperationId | trace-id (32 hex) | Same for every item of one end-to-end operation |
| id / Id | span-id (16 hex) | This request or dependency |
| operation_ParentId / ParentId | parent span-id | The caller's span |
| cloud_RoleName / AppRoleName | service.name resource attribute | Node name in Application Map |
| cloud_RoleInstance / AppRoleInstance | service.instance.id / host | Which instance/pod |
The end-to-end transaction details view (opened from Transaction search, Performance or Failures samples) shows the whole operation as a timeline with every request, dependency, trace and exception across components. If the components report to different Application Insights resources, cross-resource correlation still works as long as the reader has access to all of them. For queues and messaging, correlation is propagated in message properties (Azure SDK clients do this automatically).
// Everything that happened in one operation, ordered in time (AI Logs blade)
let op = "4bf92f3577b34da6a3ce929d0e0e4736";
union requests, dependencies, exceptions, traces
| where operation_Id == op
| project timestamp, itemType, cloud_RoleName, name, duration, success, message,
          id, operation_ParentId
| order by timestamp asc
9. Kusto Query Language (KQL) basics
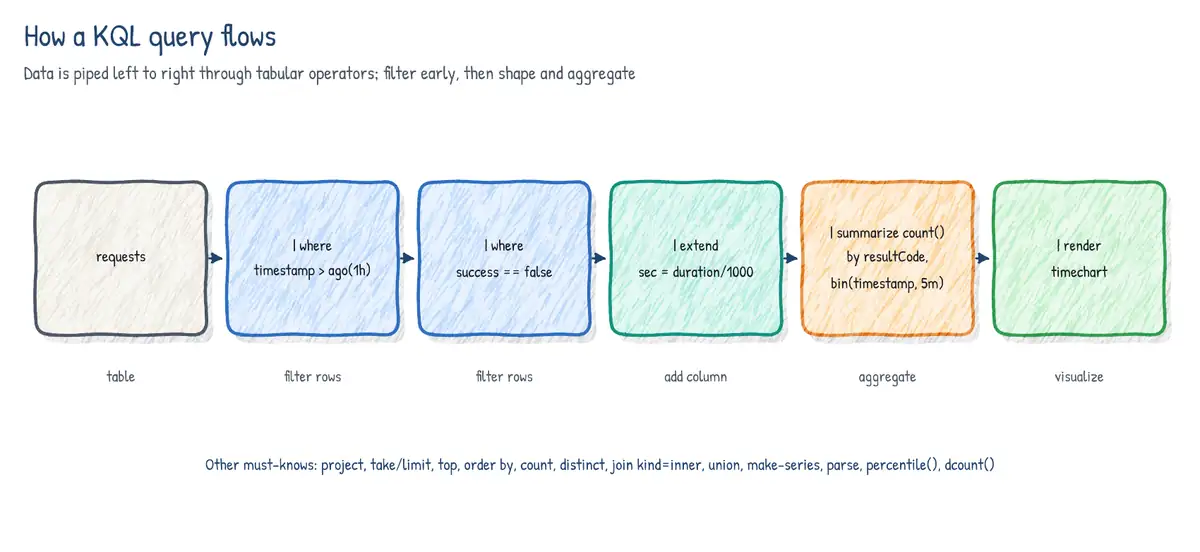
A KQL query starts with a table (or union/let/function) and pipes rows through operators with |. Each operator receives the output of the previous one, so order matters: filter early with where (especially on time) to make queries fast and cheap. Names are case-sensitive; == is case-sensitive equality while =~ is case-insensitive. String operators: has (whole term, indexed, fast), contains (substring, slower), startswith, matches regex, in, !in, has_any.
| Operator / function | Purpose | Example fragment |
|---|---|---|
| where | Filter rows | where TimeGenerated > ago(1h) and Success == false |
| project | Choose/rename columns (drop others) | project TimeGenerated, Name, DurationMs |
| project-away | Drop specific columns | project-away TenantId, SourceSystem |
| extend | Add calculated columns | extend DurationSec = DurationMs / 1000 |
| summarize | Aggregate by groups | summarize count(), avg(DurationMs) by Name |
| bin() | Round time/number into buckets | by bin(TimeGenerated, 5m) |
| percentile(s)() | Percentile aggregations | percentiles(DurationMs, 50, 95, 99) |
| dcount() | Distinct count (approximate) | dcount(UserId) |
| top N by | First N rows by a sort key | top 10 by DurationMs desc |
| order by / sort by | Sort (default desc) | order by TimeGenerated asc |
| take / limit | Arbitrary sample of N rows (no order!) | take 20 |
| join | Combine two tables on keys | join kind=inner (T2) on OperationId |
| union | Append rows of several tables | union AppRequests, AppDependencies |
| render | Visualize | render timechart |
| make-series | Build regular series incl. empty bins | make-series count() default=0 on ... |
| parse | Extract fields from text | parse Message with * "user=" User " " * |
| ago(), now() | Relative time | where TimeGenerated > ago(7d) |
| let | Name a value or subquery | let threshold = 2000; |
| iff(), case() | Conditional values | extend Slow = iff(DurationMs > 1000, 'yes', 'no') |
| countif(), sumif() | Conditional aggregation | summarize Failed = countif(Success == false) |
| arg_max() | Row with max value per group | summarize arg_max(TimeGenerated, *) by Computer |
Application Insights queries (classic names, AI Logs blade)
// 1. Failed requests in the last hour, newest first
requests
| where timestamp > ago(1h) and success == false
| project timestamp, name, resultCode, duration, operation_Id
| order by timestamp desc

// 2. Request count and P95 duration per operation over 24h (sampling-aware count)
requests
| where timestamp > ago(24h)
| summarize Requests = sum(itemCount), P95 = percentile(duration, 95) by name
| top 10 by P95 desc

// 3. Requests per 5 minutes as a time chart, split by success
requests
| where timestamp > ago(6h)
| summarize count() by bin(timestamp, 5m), tostring(success)
| render timechart

// 4. Slowest dependency targets (SQL, HTTP...) by average duration
dependencies
| where timestamp > ago(1d)
| summarize Calls = count(), AvgMs = avg(duration),
            FailRate = 100.0 * countif(success == false) / count() by type, target
| order by AvgMs desc

// 5. Top exception types since the last deployment (2 hours ago)
exceptions
| where timestamp > ago(2h)
| summarize Count = count() by type, outerMessage
| top 5 by Count

// 6. Error and critical log lines (severityLevel 3 = Error, 4 = Critical)
traces
| where timestamp > ago(30m) and severityLevel >= 3
| project timestamp, cloud_RoleName, message
Workspace table queries (AppRequests and friends)
// 7. Failure rate per role per 15 minutes
AppRequests
| where TimeGenerated > ago(12h)
| summarize Total = sum(ItemCount), Failed = sumif(ItemCount, Success == false)
            by AppRoleName, bin(TimeGenerated, 15m)
| extend FailurePct = round(100.0 * Failed / Total, 2)
| render timechart

// 8. Failed requests joined with the exception that caused them
AppRequests
| where TimeGenerated > ago(1h) and Success == false
| join kind=inner (
    AppExceptions | where TimeGenerated > ago(1h)
    | project OperationId, ExceptionType, OuterMessage
  ) on OperationId
| project TimeGenerated, Name, ResultCode, ExceptionType, OuterMessage

// 9. Percentiles of duration per hour, gaps filled with zero
AppRequests
| where TimeGenerated > ago(1d)
| make-series P95 = percentile(DurationMs, 95) default = 0
    on TimeGenerated from ago(1d) to now() step 1h
| render timechart
Infrastructure queries (Perf, Heartbeat, InsightsMetrics)
// 10. Average CPU per computer in 5-minute bins (AMA perf counters)
Perf
| where TimeGenerated > ago(4h)
| where ObjectName == "Processor" and CounterName == "% Processor Time"
      and InstanceName == "_Total"
| summarize AvgCPU = avg(CounterValue) by Computer, bin(TimeGenerated, 5m)
| render timechart

// 11. Machines that stopped sending heartbeats (possibly down or agent broken)
Heartbeat
| summarize LastSeen = max(TimeGenerated) by Computer, OSType
| where LastSeen < ago(15m)

// 12. VM Insights: P95 CPU and minimum available memory per VM
InsightsMetrics
| where TimeGenerated > ago(1d) and Origin == "vm.azm.ms"
| where (Namespace == "Processor" and Name == "UtilizationPercentage")
     or (Namespace == "Memory" and Name == "AvailableMB")
| summarize P95 = percentile(Val, 95), Min = min(Val) by Computer, Namespace, Name

// 13. VM Insights: disks with less than 10% free space (latest value)
InsightsMetrics
| where Namespace == "LogicalDisk" and Name == "FreeSpacePercentage"
| extend Disk = tostring(parse_json(Tags)["vm.azm.ms/mountId"])
| summarize arg_max(TimeGenerated, Val) by Computer, Disk
| where Val < 10
Container and activity log queries
// 14. Error lines from one namespace in AKS (ContainerLogV2 schema)
ContainerLogV2
| where TimeGenerated > ago(1h) and PodNamespace == "shop"
| where LogMessage has "error" or LogLevel == "error"
| project TimeGenerated, PodName, ContainerName, LogMessage

// 15. Legacy ContainerLog schema: stderr volume per container ID
ContainerLog
| where TimeGenerated > ago(1h) and LogEntrySource == "stderr"
| summarize Lines = count() by ContainerID
| top 10 by Lines

// 16. Parse an HTTP status and latency out of a text log line
ContainerLogV2
| where LogMessage has "status="
| parse LogMessage with * "status=" Status:int " latency_ms=" LatencyMs:long *
| summarize Requests = count(), P95 = percentile(LatencyMs, 95) by Status

// 17. Who deleted or modified resources in production (activity log)
AzureActivity
| where TimeGenerated > ago(7d) and ResourceGroup =~ "rg-prod"
| where OperationNameValue endswith "/DELETE" or OperationNameValue endswith "/WRITE"
| where ActivityStatusValue == "Success"
| project TimeGenerated, Caller, OperationNameValue, _ResourceId

// 18. Combine telemetry from two Application Insights / workspaces
union workspace("law-prod-weu").AppRequests, workspace("law-prod-neu").AppRequests
| where TimeGenerated > ago(1h)
| summarize count() by AppRoleName, _ResourceIdUsing KQL beyond the Logs blade
- Log search alert rules run a KQL query on a schedule and compare the result (row count or an aggregated measure) with a threshold.
- Workbooks combine KQL, metrics and parameters into interactive reports - Storage, Network, VM and Container insights are themselves workbooks you can copy and customize.
- Dashboards: pin query results to Azure dashboards or Grafana panels.
- Pipelines:
az monitor log-analytics query -w <workspace-guid> --analytics-query "..."lets a pipeline step evaluate health after a deployment and fail the job. - DCR transformations use a subset of KQL (
source | where ... | extend ...) to filter or mask data before ingestion, reducing cost and removing sensitive values.
10. Choosing the right tool - quick reference
| Requirement | Choose |
|---|---|
| App request latency, failures, dependencies, traces | Application Insights (OTel Distro) |
| Guest OS perf counters / syslog / event logs | Azure Monitor Agent + DCR |
| Pre-built VM perf and process/connection map | VM Insights (+ Dependency agent for Map) |
| AKS metrics with PromQL and Grafana dashboards | Managed Prometheus + Azure Managed Grafana |
| AKS container stdout/stderr | Container Insights -> ContainerLogV2 |
| Azure resource logs (Key Vault, SQL, Storage) | Diagnostic settings |
| Stream logs to an external SIEM | Diagnostic setting -> Event Hubs |
| Synthetic uptime check of a public URL | Application Insights standard availability test |
| Continuous hybrid network reachability/latency | Network Watcher Connection Monitor |
| Block deployment when production alerts are active | Query Azure Monitor alerts check / gate |
| Mark deployments on telemetry charts | Application Insights release annotations |
| Bug in Azure Boards from an alert | Action group -> Logic App (Azure DevOps connector) |
| Silence notifications during maintenance | Alert processing rule (suppression, scheduled) |
| Chat notification of pipeline failures | Azure Pipelines / GitHub app for Teams or Slack |
| GitHub Actions minutes and failure rates per workflow | Org Insights - Actions usage/performance |
| Burn-up or status chart of GitHub project items | Projects Insights charts |
Use case: 'The 3 a.m. alert'
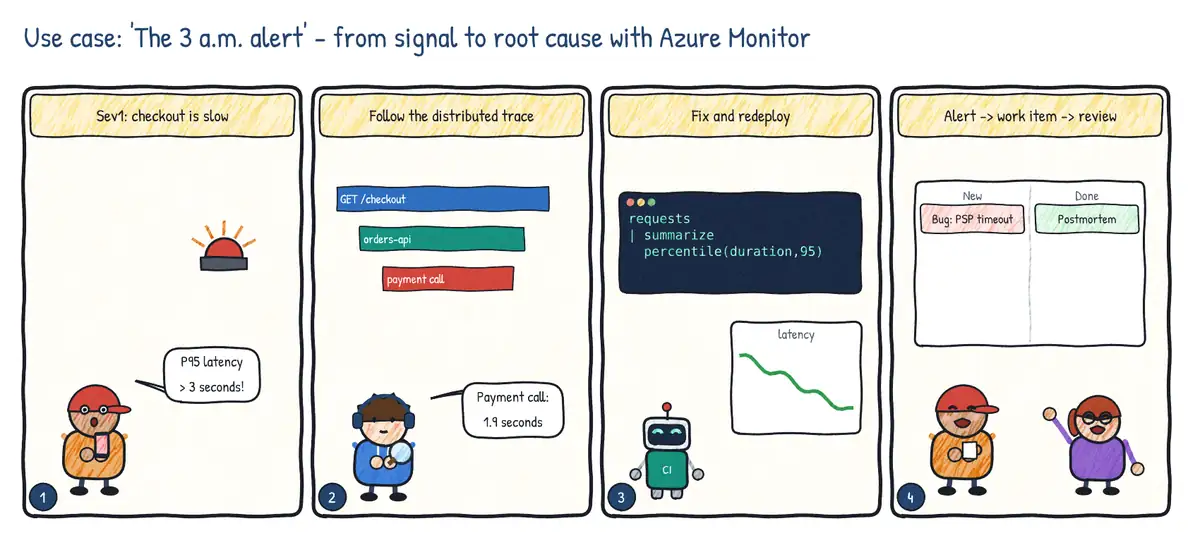
Situation. At 3 a.m. the on-call engineer is paged: checkout latency has tripled. The question is not whether something is wrong, but where.
| Step | Practice | Feature used |
|---|---|---|
| 1 | Alert on symptoms users feel | Metric / log search alert on P95 latency, action group to on-call |
| 2 | Find the slow component | Application Insights end-to-end transaction (distributed trace) |
| 3 | Prove the fix with data | KQL: percentile(duration, 95) before and after the deployment |
| 4 | Close the loop | Alert creates a work item; post-incident review updates the backlog |